Manager, Advanced Technology
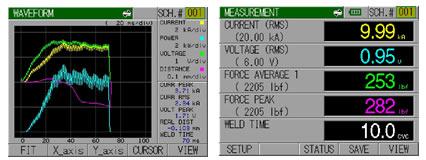
Figure 1Waveforms of current, voltage, power, and weld displacement can be displayed together on a single screen. In addition, peak or RMS values of selectable parameters can be added.
"Running blind" is an expression that can be applied to resistance welding operations throughout the manufacturing world.
Many engineers and operators have no clear information on what is actually occurring during the weld or a means to verify the equipment. As the pressure mounts on fabricators to minimize downtime, reduce scrap, and provide tracking data for customers, the monitoring tools required to do so are now available in the latest range of weld monitors.
By providing time-based waveform data on current, voltage, resistance, power, force, and displacement—as well as peak and root mean square (RMS) values—these external weld monitors are able to provide the necessary data that can be used to understand, optimize, and benchmark the weld and verify equipment (see Figure 1). The electrical data can be used to confirm that the weld resistance change and the energy delivered to the weld are consistent. This is a key quality check as each type of weld has a "good weld" resistance profile, starting at a high point indicating no joining and decreasing to a lower value indicating joining and a larger contact surface. The final resistance value and resistance profile—from the start of the weld to the end—can be used to benchmark good weld signatures. Consistently delivered energy ensures a controlled energy input and, therefore, a good indication of a controlled welding process.
In addition to the electrical data, the mechanical data (weld displacement) verifies that expected deformation has occurred. This data can be used to indicate process drift, troubleshoot, and ultimately provide data that a process is in control.
A number of steps are involved in creating a controlled and documented welding process:
Machine Setup. Machine setup involves initial verification that the equipment is performing as expected and then, when the weld is optimized, benchmarking the equipment.
The equipment consists of three parts. The control is measured for current output with time, assessing rise time and stability. The secondary circuit is measured for the voltage drop across each connection to ensure that a cable is not worn or a connection is not oxidized. The weld head is checked for force response and basic timing with the weld control.
An example of checking equipment setup is shown in Figure 2. The timing of force is shown with the blue trace, and the current is shown in yellow.
The first trace shows the current firing before constant force has been reached. Using this information, an operator can extend the squeeze time to enable the force to reach a constant level before firing. This is shown in the second trace.
If a welding process is run with insufficient squeeze time, the force at firing is variable, producing inconsistent welds. This also will make weld optimization impossible.
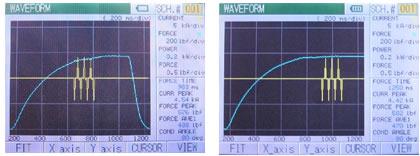
Figure 2A time history of force and current can be used to optimize the weld and ensure force is reached before firing. The left trace indicates firing before force is reached; the right shows the welder firing with optimized squeeze timing.
All of the machine setup information then can be referred to easily for verification or troubleshooting purposes. For instance, hard copies of power supply waveforms and peak or RMS values can be posted by the machine to enable quick reference.
How can this make a difference in the process? For example, if the process begins to require more current, the secondary circuit can be checked at each connection and compared against the original specifications. Any deviation from the specs will point to a faulty connection or a degraded cable.
Weld Optimization. With the option to display time-based waveforms of the current, voltage, force, displacement, resistance, or power on a single screen, the monitor can be used as a tool to optimize the weld. The timing of events within the weld can be linked to visual observations during welding and that of the finished weld. This correlation of the cause and effect of weld parameters improves understanding and also reduces the time to weld optimization.
Utilizing Weld Displacement. If current and force are the key input parameters for the weld, then weld displacement is one of the key measurable weld output parameters. The level and signature of the weld collapse provide a clear indication of the heating rate within the weld and if the correct amount of the weld energy was used.
The displacement is measured using a linear glass slide encoder that can be mounted on the weld head to provide data on initial part thickness, final displacement, and the displacement profile (see Figure 3).
For a look at how current and displacement traces indicate different welding conditions, see Figure 4.
Depending on the weld control I/O features, using a predetermined displacement value to terminate the weld may be an option. In other words, the direct physical output of the weld controls the weld energy.
A number of displacement measurements can be used:
Welding to displacement is a function that enables the monitor to terminate the weld control when a preset displacement has been reached. The actual value is determined by experimentation and is set slightly above the desired final displacement because of the thermal inertia of the weld continuing to collapse after the current has been stopped. The additional displacement after termination is consistent and highly repeatable. Using this method causes the input weld energy to vary according to a direct weld output factor that encompasses variations in all the other weld factors.
It should be noted that the termination signal from the monitor needs to be wired directly into the weld control and not through a programmable logic controller, as instantaneous termination is needed.
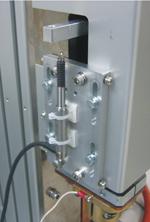
Figure 3
After the weld has been optimized, keeping tabs on when the weld moves outside of the process window can be very useful. This is applicable to individual welds or slow process drifts. Whatever the case, the monitors have the capability to provide instant recognition and an alert of an out-of-process event—preventing excessive scrap and enabling timely intervention.
Setting high and low limits is a somewhat iterative process initially determined through weld optimization. As the process matures in production, these limits usually require fine-tuning according to electrode wear and batch-to-batch part variations.
Recording weld data provides an indication that the process is in control. For certain manufacturing segments, such as the automotive industry, OEM customers demand this type of information. Undoubtedly, this requirement for recorded data is spreading to other industries.
Data output comes in two forms: hard copies and electronic. Hand-held checkers usually come with a printer option, and the mountable unit usually will have a built-in printer.
Instant hard copies of data are valuable because they can be analyzed instantly and shared. Most monitors have a useful feature that allows a waveform or screen to be printed when an error or out-of-limits condition occurs. This feature most often is linked to the mountable checkers that can indicate instantly a process drift or a step change in the weld. Electronic data collection is extracted via a COM port and sent with the desired time-stamped information directly into a spreadsheet. This data can be viewed online and archived to databases.
Along with the raw data screen capture, the control software can produce electronic records of waveforms, peak and RMS values, and weld history. Because of the size of the records and the extended time needed for downloading, engineers typically use this information as a reference rather than including it as part of the data collection records. Ideally, network connection of multiple monitors should also be possible.
The success of any monitor revolves around its ease of use and functionality. The operation should be straightforward, with user-friendly screen navigation and intuitive data analysis. The presentation of data should be clear and concise.
The display screen should accommodate color graphics to allow for easy interpretation, provide a good viewing angle for quick reading, and foster group interactions. The recorded data should be accurate and repeatable.
Monitors are either hand-held units or portable devices that can be mounted to machines (see Figure 5). The hand-held versions, more known as checkers, are used primarily for spot verification of machines. This may occur before welding a batch of parts for a customer or after a shift change.
In comparison, the machine-mountable units are either permanently attached or used for extended machine testing. They typically offer more features, such as process limits, I/O, and displacement-measuring capability.
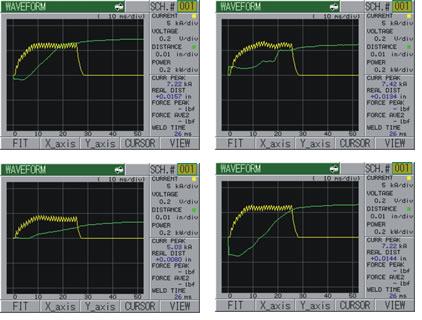
Figure 4
The hand-held units may be used with a weld-through sensor. This sensor consists of copper jaws with an internal load cell that allows the current and force to be measured at the same time between the electrodes. This quick and immediate method is ideal for spot verification of machines.
When the electrode configuration does not allow the use of this type of a sensor, the hand-held unit should allow for the connection of a toroidal coil and an input from an external load cell. The hand-held checker should be able to operate for several shifts between charging. Most units have an automatic shutoff feature that saves battery life.
Selecting the type of monitor is, of course, specific to the manufacturing environment and number of welders. The benefits of external weld monitoring—improved weld quality and process reliability with reduced scrap and machine downtime—are available to all resistance welding systems.
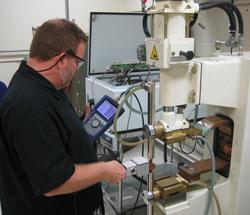
Figure 5The hand-held checker measurements should be quick and precise. A weld-through sensor enables both force and current to be measured at the same time between the electrodes. The machine-mounted checker can be used for full-time weld monitoring or troubleshooting.


The Fabricator is North America's leading magazine for the metal forming and fabricating industry. The magazine delivers the news, technical articles, and case histories that enable fabricators to do their jobs more efficiently. The Fabricator has served the industry since 1970.
start your free subscription
Easily access valuable industry resources now with full access to the digital edition of The Fabricator.

Easily access valuable industry resources now with full access to the digital edition of The Welder.

Easily access valuable industry resources now with full access to the digital edition of The Tube and Pipe Journal.

Easily access valuable industry resources now with full access to the digital edition of The Fabricator en Español.
In this episode of The Fabricator Podcast, Caleb Chamberlain, co-founder and CEO of OSH Cut, discusses his company’s...