


Contributing Writer
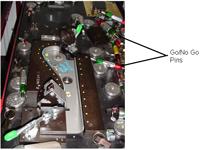
Figure 1Click image to view larger Part checking fixture
It's a simple fact that many factors contribute to a metal cutting and forming operation's success. To produce a robust stamping process, you must be able to measure the forming severity of a part. Purchasing a die for drawing or stretching sheet metal based on the visual output of the die is very risky. In other words, purchasing a die based on the fact that it produces a part that simply "holds water" or has no visible defects is no insurance that the die will produce an acceptable part every time.
To reduce the risk of producing failed parts, stampers need to know how close the part is from failing. Attribute data—meaning that the part is either good or bad—is insufficient. How bad or good is the real question. You can use tools such as circle grid and thinning strain analysis to measure the forming severity of the parts being produced. You then can adjust the process to make it more robust.
Dr. W. Edwards Deming, the father of statistical process control, once said, "In God we trust; all others bring data." Gathering hard data is the key. This article discusses ways to measure the forming severity of your parts by gathering data.
Attribute Data. This type determines if the part is acceptable or not. Many companies use part checking fixtures that rely on go/no-go pins to collect this type of data. The part usually is nested on the fixture using a couple of master location holes, as well as some surfaces referred to as nets.
After the part is nested on the checking fixture and properly clamped in place, the quality check is performed. Very simply, if the green end of the pin goes in the space between the part and fixture and the red end of the pin does not, it is considered to be an acceptable part (Figure 1).
Dimensional Data. This data usually is collected by precision measuring instruments, gauges, or a coordinate measuring machine (CMM). These instruments provide specific data with respect to the part's physical dimensions.
Visual Data. This data is derived by simply examining your parts visually. Common flaws, such as cracks, scratches, scoring, and metal defects such as rust, can be detected by a visual examination.
When manufacturing automotive body panels, such as hood roofs and doors, personnel typically scrutinize parts closely in a special, well-lit room called a highlight room. In this room, parts often are painted or covered with special highlighting oil to amplify the surface defects. It also is common for quality control inspectors to run a small, flat stone over the part's surface to detect high or low spots.
Forming Severity Data. This type of data is what I like to call the how much data. It usually is collected by using one of two common methods: thinning strain or thickness strain analysis, and circle grid analysis.
Circle grid analysis (CGA) is a process in which a blank is electrochemically etched with a pattern of perfectly round circles and deformed using the same process and production variables used to produce mass quantities of the part (Figure 2).
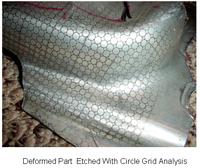
Figure 2Click image to view larger Circle Grid Analysis
Each circle's deformation then is measured using either a special camera system or a simple Mylar scale. The deformation of each circle, expressed as a percentage of change, then is plotted on a forming limit diagram. This diagram, known simply as an FLD, is a representation of the metal's deformation limits based on two primary values: the metal's thickness and its n value, or work-hardening exponent.
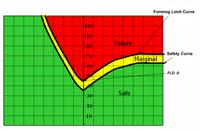
The FLD has three basic zones—red, yellow, and green (Figure 3a). Any points plotting in the red zone indicate that the part and process have failed. Visible defects such as split necks fall in the red zone.
Points falling in the yellow zone means that with your eyes you won't see visible defects, but the process is so close to failing that, statistically speaking, it will fail sooner or later.
Points falling in the green zone means that the part is safe from splitting.
By knowing how the metal has been deformed, as well as the forming limits of the particular metal, you can adjust process variables to ensure that the process is robust.
CGA also yields data with respect to metal flow patterns as well as how the metal is being deformed. This gives the toolmaker good insight should corrective action be necessary.
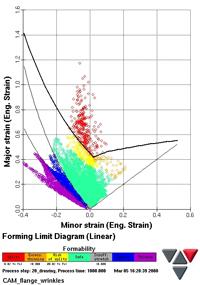
FLDs also are used during finite element analysis or forming simulation (Figure 3b).
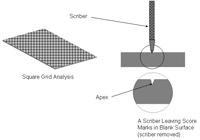
If you talk to those who have been in the stamping or die building business for many years, they might say, "That circle grid analysis is nothing new to me; why, I was doing that 40 years ago. We would spray blue dye on a blank, let it dry, and then scribe a series of squares on the surface. Then we would deform the blank and analyze metal flow patterns."
No doubt, I have used the same process myself. The truth is, although square grid analysis (Figure 4) may have helped determine metal flow patterns years ago, until recently no method was available to measure each deformed square accurately. This void made it impossible for the stamper to determine the forming severity of the part. New software combined with special cameras now can do this. Also keep in mind that scribing a pattern onto a blank leaves a score, which often is the area where a split begins.
Thinning or thickness strain analysis basically is a method in which you determine the forming severity of part by measuring its thickness. For example, if you find that a part splits when the metal thins out 25 percent in a particular area, you may establish a rule stating that no die may produce a part that thins out more than 15 percent of its original thickness. This guideline forces the diemaker to limit metal stretching in the die, therefore reducing the forming severity of the part. A special pin micrometer or an electronic ultrasonic thickness tester can be used to determine metal thinkness.
The key to a robust stamping operation is to measure the output of the process and ensure that it is a reasonable distance from failing. Only by knowing the process's results can you establish the necessary data to support changing it. Variables such as differences in the metal thickness and mechanical properties can and will cause minor part variations. The key is to reduce the potential for parts splitting.


The Fabricator is North America's leading magazine for the metal forming and fabricating industry. The magazine delivers the news, technical articles, and case histories that enable fabricators to do their jobs more efficiently. The Fabricator has served the industry since 1970.
start your free subscription
Easily access valuable industry resources now with full access to the digital edition of The Fabricator.

Easily access valuable industry resources now with full access to the digital edition of The Welder.

Easily access valuable industry resources now with full access to the digital edition of The Tube and Pipe Journal.

Easily access valuable industry resources now with full access to the digital edition of The Fabricator en Español.
In this episode of The Fabricator Podcast, Caleb Chamberlain, co-founder and CEO of OSH Cut, discusses his company’s...


