80/20 homework
Use 80/20 to improve an industrywide challenge: on-time delivery
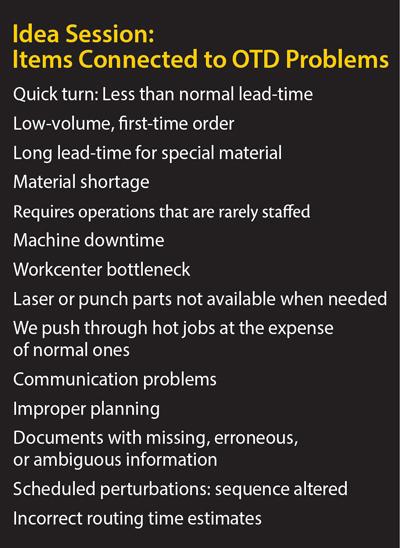
Figure 1
This list shows characteristics, notions, and symptoms that
many fabricators have determined to be related to on-timedelivery
(OTD) problems. Note that these are not root causes.
On-time-delivery (OTD) problems seem to be widespread in the custom fabrication industry. That’s because this is the custom anything industry. Variation abounds—parts, volumes, routings, demand levels, you name it—and with variation comes complexity.
To deal with high variation you have only three buffers available: inventory, capacity, and time. To accommodate highly variable demand over hundreds or thousands of customers’ part numbers, custom fabricators are rightfully very reluctant to build a finished-goods inventory buffer. The inventory approach is expensive, risky, and can be an economic disaster unless an ironclad agreement is in place for the customer to pay for the buffer. If they exist, these agreements are just for certain jobs for one or two top customers. For most parts, such an agreement is not practical or desirable, because customers usually have no better idea of a product’s future short-term demand than you do.
The capacity buffer also is expensive, though usually less costly than an inventory buffer. Most companies choose the capacity buffer in the form of overtime. The time buffer, or using more time to complete an order, can come into play, but this means the order can be overdue.
According to the annual Financial Ratios & Operational Benchmarking Survey, published by the Fabricators & Manufacturers Association International®, OTD remains stuck in the mid to high 80 percent range. This is hardly world-class and is often a very sore spot with customers. For fabricators, the OTD problem remains a source of serious vulnerability to losing business. It should be addressed vigorously.
The seemingly logical solution would be to increase the buffer size: that is, increase capacity at the cost of either underutilized assets or more overtime, or increase the time buffer at the front end—start the job earlier. But the latter is often not practical and the former is always expensive.
In reality, you must dig deeper to uncover the real reasons behind OTD problems, and then use 80/20 to systematically improve. Sometimes you are left with no choice but to increase the buffers, but only after you have exhausted less expensive options.
Pencils ready? Here are your 80/20 homework assignments.
Your First Assignment
Hold an idea session and describe all of your characteristics and notions that hinder OTD performance. To start, check out Figure 1, which shows the results from one custom fabricator’s actual idea session. The fabricator listed (in no particular order) the characteristics, notions, and symptoms that it determined were related to OTD problems.
This list, unfortunately, is as far as many companies go, even though virtually all of the items on it are symptoms, not root causes. That’s perfectly normal in an idea session and a good start. Just know that you probably won’t be able to act upon most of them.
In fact, any actions derived directly from an initial idea session will be vague and usually lead nowhere. To obtain information that can be acted upon, using the 80/20 method, you must uncover root causes for the items gathered during the idea session.
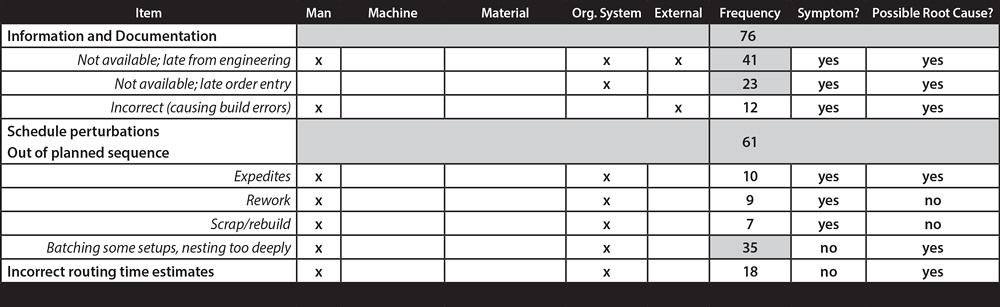
Figure 2
Three root causes—orders late from engineering, late order entry, and batching like orders—account for at least 45 percent of the on-time-delivery problems.
First, find out how frequently each item on the list occurs. This can be an educated guess to start but should eventually involve real data. For example, you can list items in one column and in a separate column list the frequency. At first you can use generic terms like “infrequent,” “hardly ever,” and “a lot,” but eventually you should add the actual number of occurrences during a given period.
Your Second Assignment
Now comes the next idea session, which entails digging deeper to find actual or likely root causes. This can be extraordinarily tedious if you dig deep into every symptom, so this is where you can apply the first layer of the 80/20 method. Select the top three to five by frequency, and focus on those for the deep dives.
Discovering the relationship between root causes and symptoms isn’t always straightforward. One symptom can have multiple root causes, and one root cause can lead to multiple symptoms. On top of this, some items can be a symptom in some cases and a root cause in other cases.
Figure 2 shows a second-layer 80/20 dive that focused on the most frequently occurring items. Among those, the top three accounted for about 45 percent of the total. But these root causes not only affected the items being scrutinized, but other items as well. In reality, these three root causes account for at least—and probably more than—45 percent of the OTD problems.
Note that expedites got the most attention and complaints during the idea session. Why? They’re easy to complain about, and you really can’t act upon them. They’re basically a ready-made excuse for doing nothing except blame the salespeople. But expedites, as Figure 2 shows, were in fact way down on the actual priority list. They usually are.
Notice also that the common denominator among the top three root causes was related to organization (labeled “Org. System” on the chart). Late deliveries often were caused not by the customer, or suppliers, or even the “damn salespeople.” They were caused by how the custom fabricator operates. (Another benefit of 80/20 is a dose of humility!)
Your Third Assignment
Finally, turn “possible root causes” into actionable causes. Connections between events abound. In the current example, the “late from engineering” item was an apparent root cause in some instances, but in other cases it was a symptom caused by “late order entry,” which also happened to be a root cause of “material not available.”
Ultimately, the final dive into those three root causes led the fabricator to the following three items. These affected about 50 percent of the occurrences that led to late deliveries:
- Late from engineering: Root causes were late order entry, unnecessary redrawing of customer files, and batch releases.
- Late order entry: Root cause was batching of entries in sales, an example of optimizing efficiency locally at the expense of the whole.
- Batch setups; deep nesting: Root causes were trying to optimize efficiencies on individual machines and nesting too far ahead, more examples of local efficiency optimization hurting overall efficiency. This led to excessive work-in-process and parts not being available downstream when needed.
Idea Session:
Items Connected to OTD Problems
Quick turn: Less than normal lead-time
Low-volume, first-time order
Long lead-time for special material
Material shortage
Requires operations that are rarely staffed
Machine downtime
Workcenter bottleneck
Laser or punch parts not available when needed
We push through hot jobs at the expense of normal ones
Communication problems
Improper planning
Documents with missing, erroneous, or ambiguous information
Scheduled perturbations: sequence altered
Incorrect routing time estimates
About the Author

Dick Kallage
About the Publication

subscribe now

The Fabricator is North America's leading magazine for the metal forming and fabricating industry. The magazine delivers the news, technical articles, and case histories that enable fabricators to do their jobs more efficiently. The Fabricator has served the industry since 1970.
start your free subscription- Stay connected from anywhere

Easily access valuable industry resources now with full access to the digital edition of The Fabricator.

Easily access valuable industry resources now with full access to the digital edition of The Welder.

Easily access valuable industry resources now with full access to the digital edition of The Tube and Pipe Journal.

Easily access valuable industry resources now with full access to the digital edition of The Fabricator en Español.
- Podcasting

In this episode of The Fabricator Podcast, Caleb Chamberlain, co-founder and CEO of OSH Cut, discusses his company’s...
- Trending Articles
1
AI, machine learning, and the future of metal fabrication

2
Employee ownership: The best way to ensure engagement

3
Steel industry reacts to Nucor’s new weekly published HRC price

4
Dynamic Metal blossoms with each passing year

5
Metal fabrication management: A guide for new supervisors