Product Manager, ShopFloorConnect

The software systems that you use to run your business, including enterprise resource planning (ERP) and manufacturing execution systems (MES), rely on production data collected from the shop floor. In most cases, this data is collected manually and entered into the system by a human operator.
The three common problems with manually collected data are untimeliness, inaccuracy, and bias. Considering that this raw data forms the basis for all subsequent production reports—and that important decisions are made based on those reports—any problems with the initial data collection can start a ripple effect that results in a negative impact on your business.
In a typical scenario, manually collected production data is entered into the system only at predetermined times, such as at the end of a shift or job. The data then is made available in the form of reports and used for analysis.
For long-term analysis, viewing the data after the fact usually is sufficient. However, the factory floor is a dynamic environment, and knowing what happened only after the fact can be a detriment to productivity.
Manually entered data also can be incomplete. This is because the actual data entry task usually falls to someone with many other responsibilities. Generally speaking, data entry is a tedious task that often is put off for as long as possible. It is not uncommon for raw data to sit around for hours, if not days, before being entered into the system. As a result, reports don't show the latest data.
Often the data must be written down first and later entered into the system—sometimes by a different person than the one who recorded it in the first place. Typographical and transcription errors are common. Once these errors become part of the data set, they become difficult to detect and eradicate, making all the resulting reports suspect.
In addition, a human operator has influence over what information is entered and when. For instance, assume that the controller on Machine No. 1 detects an easily correctable tooling problem and shuts down the machine. The operator responsible for Machine No. 1 is busy performing a changeover or troubleshooting a problem elsewhere in the plant. Machine No. 1 sits idle for an hour while the operator is otherwise occupied.
When the operator is free, he spends five minutes fixing the tooling problem and then restarts Machine No. 1. Even though he was busy with another machine, the operator is worried that he'll be disciplined for not attending to Machine No. 1 quickly enough, so he enters "Tooling problem —1 hour and 5 minutes" in Machine No. 1's log as the reason for downtime.
In reality, this is wrong. The machine was down for 1 hour and 5 minutes, but the real reason for most of this downtime was not a tooling problem; it was that no operator was available.
If the problem is not properly identified as "We need an additional operator," it ends up being misdiagnosed as a costly engineering project: "We need better tooling."
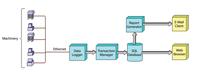
Figure 1. Click for a larger view. In a typical data collection system, the data logger, transaction manager, database, and report generator operate together on a single server.
Collecting production data automatically, as it happens, can help eliminate these problems. Until recently commercially available data collection software tended to be vendor-specific, especially if it collected data from proprietary machine controllers. If you had several different types of machinery and controllers, you'd need several different data collection systems that would have to be custom-integrated by a third-party software writer. Many proprietary collection systems required a special serial network and client software.
Today the emergence of high-speed Ethernet as the de facto standard for local area networks has decreased the cost of network cards, adapters, and other hardware, allowing Ethernet to replace dedicated serial networks.
Data collection software now can use a Web browser to display and manipulate data and e-mail to distribute reports. This has eliminated the need to install maintenance-intensive client software on workstations.
Database manufacturers have adopted Structured Query Language (SQL) as a means to get data in and out of various databases. This makes it easier for different software packages to share data and allows an SQL-based data collection system to provide data to MES and ERP software.
In addition, Microsoft® and more than 150 automation suppliers got together and developed a set of standards, called OLE for Process Control (OPC), that allow for interoperability of different devices.
One of the biggest challenges in automated data collection was finding a way to communicate with many different types of equipment. Today the maturation and widespread use of communication protocols have provided the means to move raw data in and out of many proprietary controllers, programmable logic controllers (PLCs), and other devices.
Finally, the adoption of the OPC Data Access Specification by controller manufacturers has enabled interoperability in multivendor systems. To be certified, OPC devices must pass a series of compliance tests.
In the industrial automation world before OPC, every manufacturer had to write its own proprietary drivers to enable their controllers to communicate with Windows®. Any data collection system that needed to communicate with a variety of controllers had to have a driver for every controller. The manufacturers were not coordinated, and many of the controller drivers conflicted with one another, making the data collection system inoperative.
Adding the OPC specification to Microsoft's OLE technology in Windows allowed automation manufacturers to create nonconflicting, Windows- compatible drivers that standardized the method of data communication.
A modern data collection system comprises a data logger, a transaction manager, a database, and a report generator. These programs (shown in blue in Figure 1) typically operate together on a single server. Some configurations have the database running on a separate server.
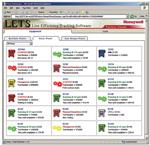
Figure 2. Click for a larger view. A graphic summary displays the state of each machine.
The two client portions are made up of an e-mail client to receive reports and a Web browser. The browser acts as the front end to the system and is used to view real-time data, as well as for setup and maintenance, security access, and so forth.
Data Logger. The data logger is a program that gathers the production data and puts it in a database. Two different data logging methods can be employed by data collection systems: distributed data loggers and centralized data loggers.
In a distributed system, a data logger is installed on each machine. The data logger collects production data directly from the machine, stores it in memory, and periodically sends it off to the data repository (usually a database). In the event of a network outage, the onboard data logger can continue to collect production information from the machine while the network is down and then backfill the database when the network comes back up.
In a centralized system, one data logger continually polls each individual production machine. Since the system operates at Ethernet speeds, the data coming from the production machinery can be displayed within a few seconds of real time. The machine needs to pass only a few of the most recent data items (called tags) during each polling cycle. Because the controller on the production machine does not need to store and organize data, it is a simple matter to modify existing controls to provide the tags. If there is a power failure, data will be lost.
Transaction Manager. The transaction manager receives the raw data from the data logger, parses it, performs operations on it, and stores it in the database.
Database. The database stores all of the production information and feeds the report generator and Web browser front end. An SQL database simplifies the transfer of data to and from other software. The database for a data collection system should be able to handle multiple users simultaneously and be scalable to grow with your needs.
Report Generator. The report generator allows you to create tabular and graphic reports from the information in the database. Reports typically can be configured to display data according to the date range, shift, machine, tool/ part, and/or operator. For example, you could specify that you want a report showing production data for four of your machines while they are making 10 specific parts, being run by five selected operators, on third shift. Once these reports are configured, you can save the settings as a new report.
The report generator also controls report distribution. Reports typically can be sent to a printer, sent via e-mail to any recipients that you choose, and posted on your network as HTML documents that can be viewed in a Web browser by anyone with appropriate access.
In addition, the report generator schedules when reports are distributed. For example, you could set the report generator to post the previous day's production report onto your network each morning.
Once you've set up the distribution schedule, the report generator automatically will generate and distribute the reports.
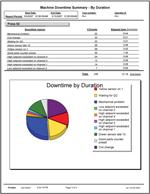
Figure 3. Click for a larger view. Error codes are shown on the downtime summary.
You can learn a lot about your operation by collecting just three pieces of data, or data tags, from each machine or line: part count, machine state, and an error code that corresponds to a downtime reason.
Part Count. Collecting an accurate part count is not as simple as it might appear. When the transaction manager receives a count from the data logger, it must compare it to the counter value collected from the previous polling cycle.
Advanced systems also compare both the current and previous counter values to a third hidden, nonresettable counter to determine if the counter was manually changed by the machine operator, reset because a new job was started, or rolled over because it reached a maximum value. By running the three counters through various algorithms, the transaction manager can correctly decide how to place this information into the database to prevent nonsense data.
Machine State. The machine state is the current condition of the machine. Typical states are running, idle, unplanned down, planned down, changeover/setup, and offline.
The transaction manager constantly watches the machine state and logs the elapsed time accordingly. The transaction manager logs every second of time to one of these states and provides a graphic summary (see Figure 2).
Error Codes. The most efficient way to track downtime is for the data logger to collect an error code anytime a machine is stopped. These error codes can be automatically generated by the controller on the machine or can correspond to a list of downtime reasons that are manually selected by the machine operator.
The error code is placed into the database by the transaction manager and compared to a lookup table specifically created for each machine in the database. Using an error code instead of an error message minimizes network traffic.
By comparing the error code to a lookup table unique to each machine, you can create a different set of downtime reasons for each machine type. This way, you can create a small set of specific downtime reasons that make sense for each machine (see Figure 3).
Other Data. Depending on the machine or line, data such as temperature, pressure, force, and other process parameters may also be collected. Typically, this type of data is stored along with a time and date stamp and can be put into report form as a graph over a specified time period.
Ideally, all data collected from a production machine would be collected automatically with no input required from the machine operator. Unfortunately, this is not possible. While part count and machine state usually can be collected without operator input, the exact reasons for downtime cannot.
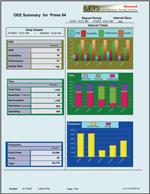
Figure 4. Click for a larger view. An OEE report takes into account machine availability, performance, and quality.
It may be possible to collect some downtime reasons automatically. If a machine is equipped with an "intelligent" controller or monitoring device and the controller initiates the machine stop, the reason can be reported back to the data logger automatically in the form of an error code.
However, if the machine is stopped by the operator or by a piece of ancillary equipment, the data collection software will not be able to determine the reason for stoppage. When this is the case, the transaction manager is forced to log this time as idle time. Since one of the main benefits of a data collection system is to identify reasons for productivity loss, simply logging idle time is unhelpful.
The most effective way to enable an operator to specify the cause of a machine stoppage is to provide a menu of choices from which the operator selects the appropriate downtime reason. If the machine is equipped with a PLC or PC-based control with a menu-driven human-machine interface (HMI), then this downtime menu usually can be added to the program. If not, a simple downtime terminal can be constructed from an Ethernet-compatible PLC and HMI or purchased as a unit.
It is not enough simply to create the menus or install the terminal and instruct the operator to select a downtime reason. Unless the operator is reminded, he or she will not always select a downtime reason each time the machine stops. Remember, if the machine is restarted without selecting a reason, the time will be logged as idle, and the real reason for the stoppage is lost.
One way to remind the operator to select a downtime reason is to set the controller or data terminal to prevent machine restart until a reason is selected. There usually is a short grace period to allow for brief stoppages, but if the machine is stopped for a significant amount of time, the operator will be forced to select a downtime reason.
Data collection cannot come at the expense of productivity. A few design considerations can help minimize the negative impact on production.
Carefully select about a dozen reasons for each machine. It helps if you standardize the reasons for each machine type so that operators are not forced to learn a new menu when they move from machine to machine. Put the most frequently selected downtime reasons near the top of the menu. If the controller or terminal has multiple menus, set it to display the downtime reason menu automatically when it is looking for a downtime reason. This helps to minimize unnecessary navigation on the operator's part.
Collected production information can be passed on to ERP and MES systems. Schedulers can use the system to accurately predict when jobs will finish and machines will be available. Production counts and efficiencies can be put into report form and distributed.
Overall Equipment Effectiveness. One of the most important metrics that can be created with the data is overall equipment effectiveness (OEE) (see Figure 4). This is a simple percentage that shows the ratio of actual equipment output to its theoretical maximum. OEE factors in equipment availability, speed performance, and quality and is based on the premise that all production losses on machines and processes can be measured and quantified.
OEE is calculated using a simple formula:
OEE = Availability x Performance x Quality
Availability accounts for unplanned downtime losses. It is equal to the actual machine/process running time divided by the total available time. Planned downtime events such as lunch breaks are not part of, and don't affect, the OEE calculation.
Performance accounts for speed loss. It is equal to the ratio of the number of parts produced over the measurement period (shift, day, etc.) to the theoretical maximum number of parts that could be produced if the machine or process ran at its highest possible speed.
Quality is the ratio of good parts to total parts produced.
During an eight-hour shift with 30 minutes for lunch and two 15-minute breaks, a machine has a maximum availability of 7 hours (420 minutes). If there were 82 minutes of unplanned downtime during the shift, then the machine would have actually run for 338 minutes. The availability would be calculated as:
Availability = 338 minutes/420 minutes = 80%
Running at full speed, the machine can produce 6,000 parts per hour (or 100 parts per minute). During the 338 minutes of running time, the machine made 25,000 parts. The performance percentage is calculated:
Performance = 25,000 parts/338 minutes/100 parts per minute=74%
Out of the 25,000 parts produced, 500 had to be scrapped. The quality percentage is calculated as follows:
Quality = 24,500 good parts/25,000 total parts = 98%
The OEE for this example is:
OEE = Availability (80%) x Performance (74%) x Quality (98%) = 58%
Although the component measurements indicate an efficient process, when taken together as OEE, the process really is only 58 percent effective.
Scheduling. To execute a manufacturing plan effectively, the person doing the scheduling in a production environment must have a keen insight into any hidden inefficiencies, as well as an intimate knowledge of how well each machine runs each part that must be produced. Given enough time, a well-designed data collection system can provide you with an unbiased version of this information.
Over time data collection software will measure the production rate for every machine as it produces every part. In addition, it can track the changeover time for each machine as it changes from one part to the next. This data becomes more accurate the longer the system tracks it.
Given this information, a data collection system can accurately predict when jobs will be finished. By adding in changeover time, as well as applying the measured efficiency to the quantity of parts that are required for a run, the software can indicate the time and date of completion for any job in the schedule queue. It also can indicate when exceptions occur by simply comparing the estimated complete time/date to the due date for the job.
Event Logs. Have you ever wondered what exactly led up to a catastrophic event in a machine on third shift? An automatic data collection system can tell you.
Many systems create event logs, time- and date-stamped lists of every event that occurred on a machine. These are invaluable when you're trying to troubleshoot or find the root cause of a machine problem.


The Fabricator is North America's leading magazine for the metal forming and fabricating industry. The magazine delivers the news, technical articles, and case histories that enable fabricators to do their jobs more efficiently. The Fabricator has served the industry since 1970.
start your free subscription
Easily access valuable industry resources now with full access to the digital edition of The Fabricator.

Easily access valuable industry resources now with full access to the digital edition of The Welder.

Easily access valuable industry resources now with full access to the digital edition of The Tube and Pipe Journal.

Easily access valuable industry resources now with full access to the digital edition of The Fabricator en Español.
In this episode of The Fabricator Podcast, Caleb Chamberlain, co-founder and CEO of OSH Cut, discusses his company’s...